UEBA
User and Entity Behavior Analytics for anomaly detection and insider threat identification.
The User and Entity Behaviour Analytics (UEBA) module detects anomalous user activity by aggregating Windows Security Event Logs collected via Winlogbeat or Endpoint Security agents. A Python-based data pipeline, installed as a Network Probe integration package, runs on a configurable schedule (default: every 30 minutes), queries source indices, and writes per-user event summaries to the uba* index. Six pre-built Empowered AI rules then analyse these summaries for potential threats such as DDoS, APT, and ransomware patterns. Results are presented across three dashboards: Events, Empowered AI, and Raw Logs.
Prerequisites
The UEBA integration is an optional Network Probe package. Before using UEBA dashboards, ensure the following:
Network Probe is installed and running.
The
ubaintegration package is installed from the Network Probe integrations store.A Windows Security Event Log source is available — either
windows-winlogbeat-*(Winlogbeat) orwazuh-alerts-*(Endpoint Security agents).
Configuration
After installation the integration is configured through config.json located in the pipeline directory. Key settings:
Parameter |
Description |
Default |
|---|---|---|
|
Data source type: |
|
|
Source index pattern |
|
|
Destination index name |
|
|
Aggregation interval in minutes |
|
|
Filters out system accounts (machine accounts ending with |
pre-configured |
Events
The [UEBA] Overview dashboard presents aggregated event data from the uba* index. Data can be filtered by User, Computer name, Event, and Source.
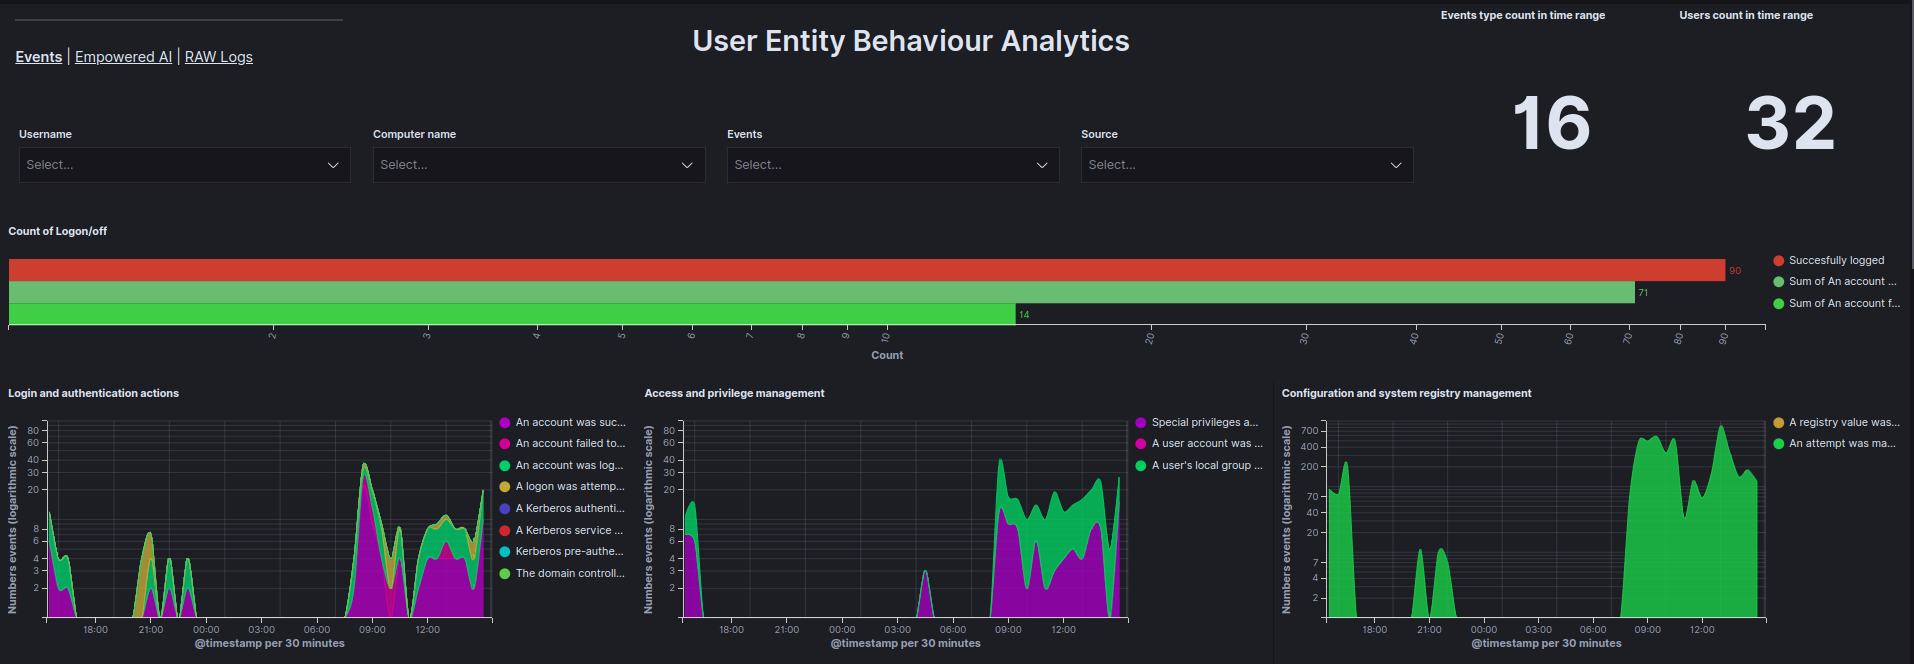
Data is visualized using the following graphs:
Count of Logon/off - Total count of
Logon,Logoff, andFailed to Logonevents within a specified time range.Login and authentication actions - Count of login and authentication events as a function of time.
Access and privilege management - Count of access and privilege management events as a function of time.
Configuration and system registry management - Count of configuration and system registry management events as a function of time.
Service and process management - Count of service and process management events as a function of time.
Management of facilities and access to resources - Count of facility management and access-to-resource events as a function of time.
Account and group management - Count of account and group management events as a function of time.
Top 10 reported events - Ranking of the most frequently occurring events.
Top 10 users by events count - Ranking of users generating the most events.
Top 5 users by document count - Table showing the top 5 users by document count.
User - Events metrics - Number of actions for each event based on the user.
Matrix User - Computer Name - A matrix showing which users are using which devices.
Empowered AI
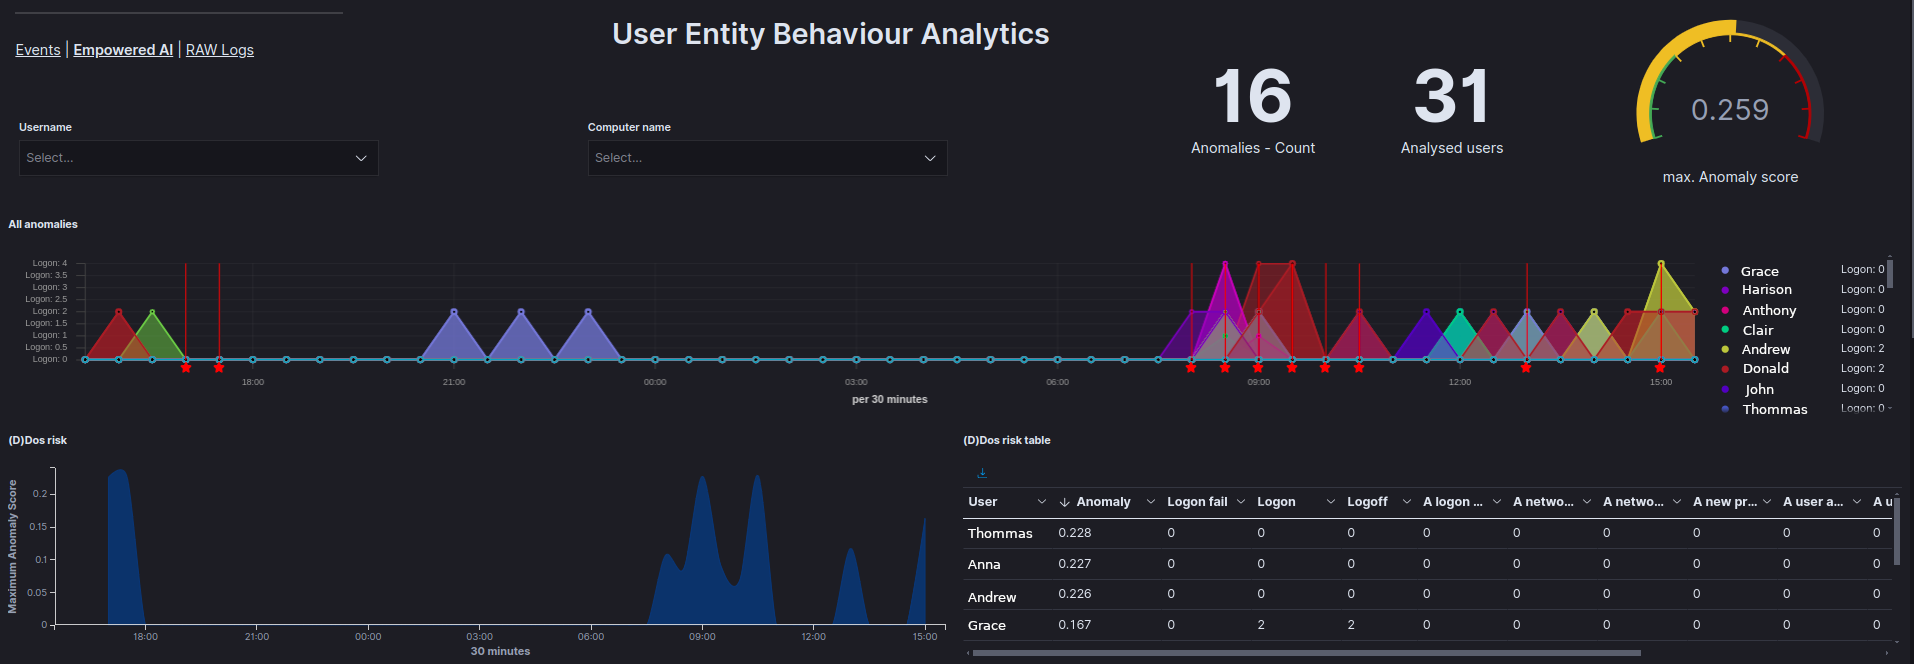
The [UEBA] Empowered AI dashboard displays results from six pre-built AI rules that target the uba* index. Each rule analyses per-user event summaries and produces an Anomaly_score. The dashboard contains the following visualizations:
All anomalies - Displays all anomalies on a timeline per user.
(D)DoS attack probability - Shows the results of analyses checking whether a (D)DoS attack has occurred.
(D)DoS risk table - Displays the results of the analysis for each user in the
Anomaly_scorefield and allows for the review of values for each field analyzed.APT attack probability - Displays the results of analyses checking for potential APT attacks.
APT risk table - Displays the results of the analysis for each user in the
Anomaly_scorefield and allows for the review of values for each field analyzed.Ransomware attack probability - Displays the results of analyses checking for potential ransomware attacks.
Ransomware risk table - Displays the results of the analysis for each user in the
Anomaly_scorefield and allows for the review of values for each field analyzed.All events anomaly - Displays the results of analyses for all fields provided by the UBA data pipeline to identify abnormal user behavior.
All events anomaly table - Displays the results of the analysis for each user in the
Anomaly_scorefield and allows for the review of values for each field analyzed.Services installation anomaly - Displays the results of analyses related to service installation anomalies.
Logon anomaly - Displays the results of analyses related to
Logon,Logoff, andFailed to Logonevents.Users risk scores - Displays the highest and average
Anomaly_scorefor each user and the type of analysis in which that score occurred.High risk users - Shows a pie chart highlighting the users most affected by anomalies.
Raw Logs
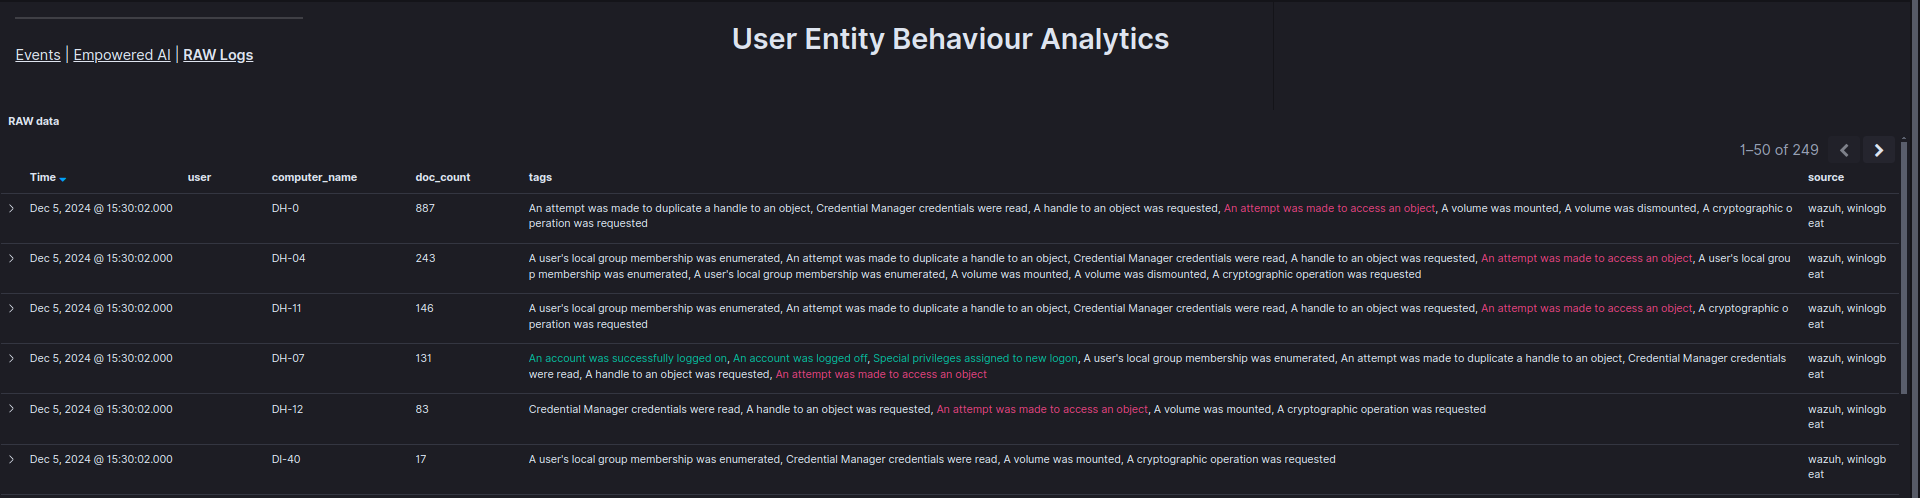
The [UEBA] RAW Logs dashboard displays raw records from the uba* index in a table, enabling verification of specific events, including the time, user, and device involved.
See also AI and Analytics for additional machine learning capabilities including anomaly detection rules and clustering.