Reporting
The Reports module provides tools for exporting data and generating graphical reports. It consists of three tabs: Data Export, Report Export, and Settings.
Data Export
The Data Export tab allows you to export raw data from indices to CSV or HTML files. To access it, click the Reports icon in the top menu and go to the Data Export tab.
The tab contains two sub-tabs: Create Task and Task List.
Create Task
The form is divided into the following sections:
General
Enter a task name in the Task name field and select the export type: CSV or HTML.
Data
Select the data source for the export. You can use a saved search to quickly access a predefined query and index pattern, or select an index pattern directly from the Index pattern dropdown. Use the Query field to filter the data that will be exported.
Time range
Choose the date range for the export. Enable the time range toggle and select the period using the date picker. The Time field defaults to @timestamp. If neither the time field nor the index pattern is selected, @timestamp will be used by default. To export all available data without a time filter, disable the toggle.
Fields
By default all fields are exported. Use the Retrieved fields selector to limit the export to specific fields. Additional options:
Include unmapped fields — includes fields that do not appear in filters or dashboards. Enabling this option may significantly increase export duration.
Include meta fields — includes metadata fields. Disabled by default.
Limits
Max document count — maximum number of documents to export. Default: 10,000, maximum: 100,000. Set to 0 to disable the limit.
Fast mode — skips intermediate file creation for faster processing. Recommended for large exports.
Scheduling
Exported data can be sent automatically via email to configured recipients. To enable scheduling, click the Disabled toggle — it will switch to Enabled and reveal the following fields:
Field |
Purpose |
|---|---|
Email topic |
Subject line of the notification email. |
Email addresses |
One or more recipient addresses. Invalid entries are rejected. |
Select role |
Role assigned to the scheduled task. See Role selection for scheduled tasks. |
Schedule type |
|
Cron format |
Custom cron expression, shown only when |
Note
Scheduling requires a one-time setup that creates a trusted token for the scheduler service. When scheduling is not yet enabled, the Data Export tab shows the message “Scheduling is disabled right now. Please request your Admin to enable this feature.” and — for admin users — an Enable Scheduling button that performs the setup. Non-admin users need an administrator to click it.
After configuring all options, click Submit to create the task.
Role selection for scheduled tasks
The Select role field controls two independent checks:
Task visibility. Non-admin users only see tasks whose assigned role matches one of their own roles; admins see all tasks.
Dashboard and data access. The assigned role must have access to the dashboard (for Report Export) or to the index pattern and fields (for Data Export). A role that cannot open the dashboard in the GUI cannot be used for a recurring report against it.
Data Export downloads. For Data Export specifically, a user whose roles do not overlap with the role assigned to the task will not be able to download the generated file from the Task List.
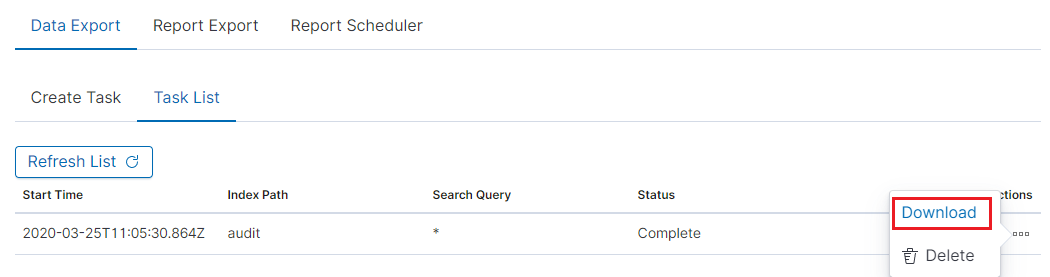
Task List
The Task List sub-tab displays all created export tasks with their current status. When the status changes to Completed, you can download the file using the Download button or remove it with the Delete button.
The refresh symbol  updates the task list status.
Quick Report from Discovery
You can initiate a data export directly from the Discover tab. After configuring your index pattern, query, fields, and time range in Discover, use the Data Export Wizard button to open the Data Export form pre-filled with your current Discover settings. This avoids manually re-entering the same parameters in the Reports module.
Report Export
The Report Export tab allows you to generate graphical reports from dashboards in PDF, JPG, or DOCX format.
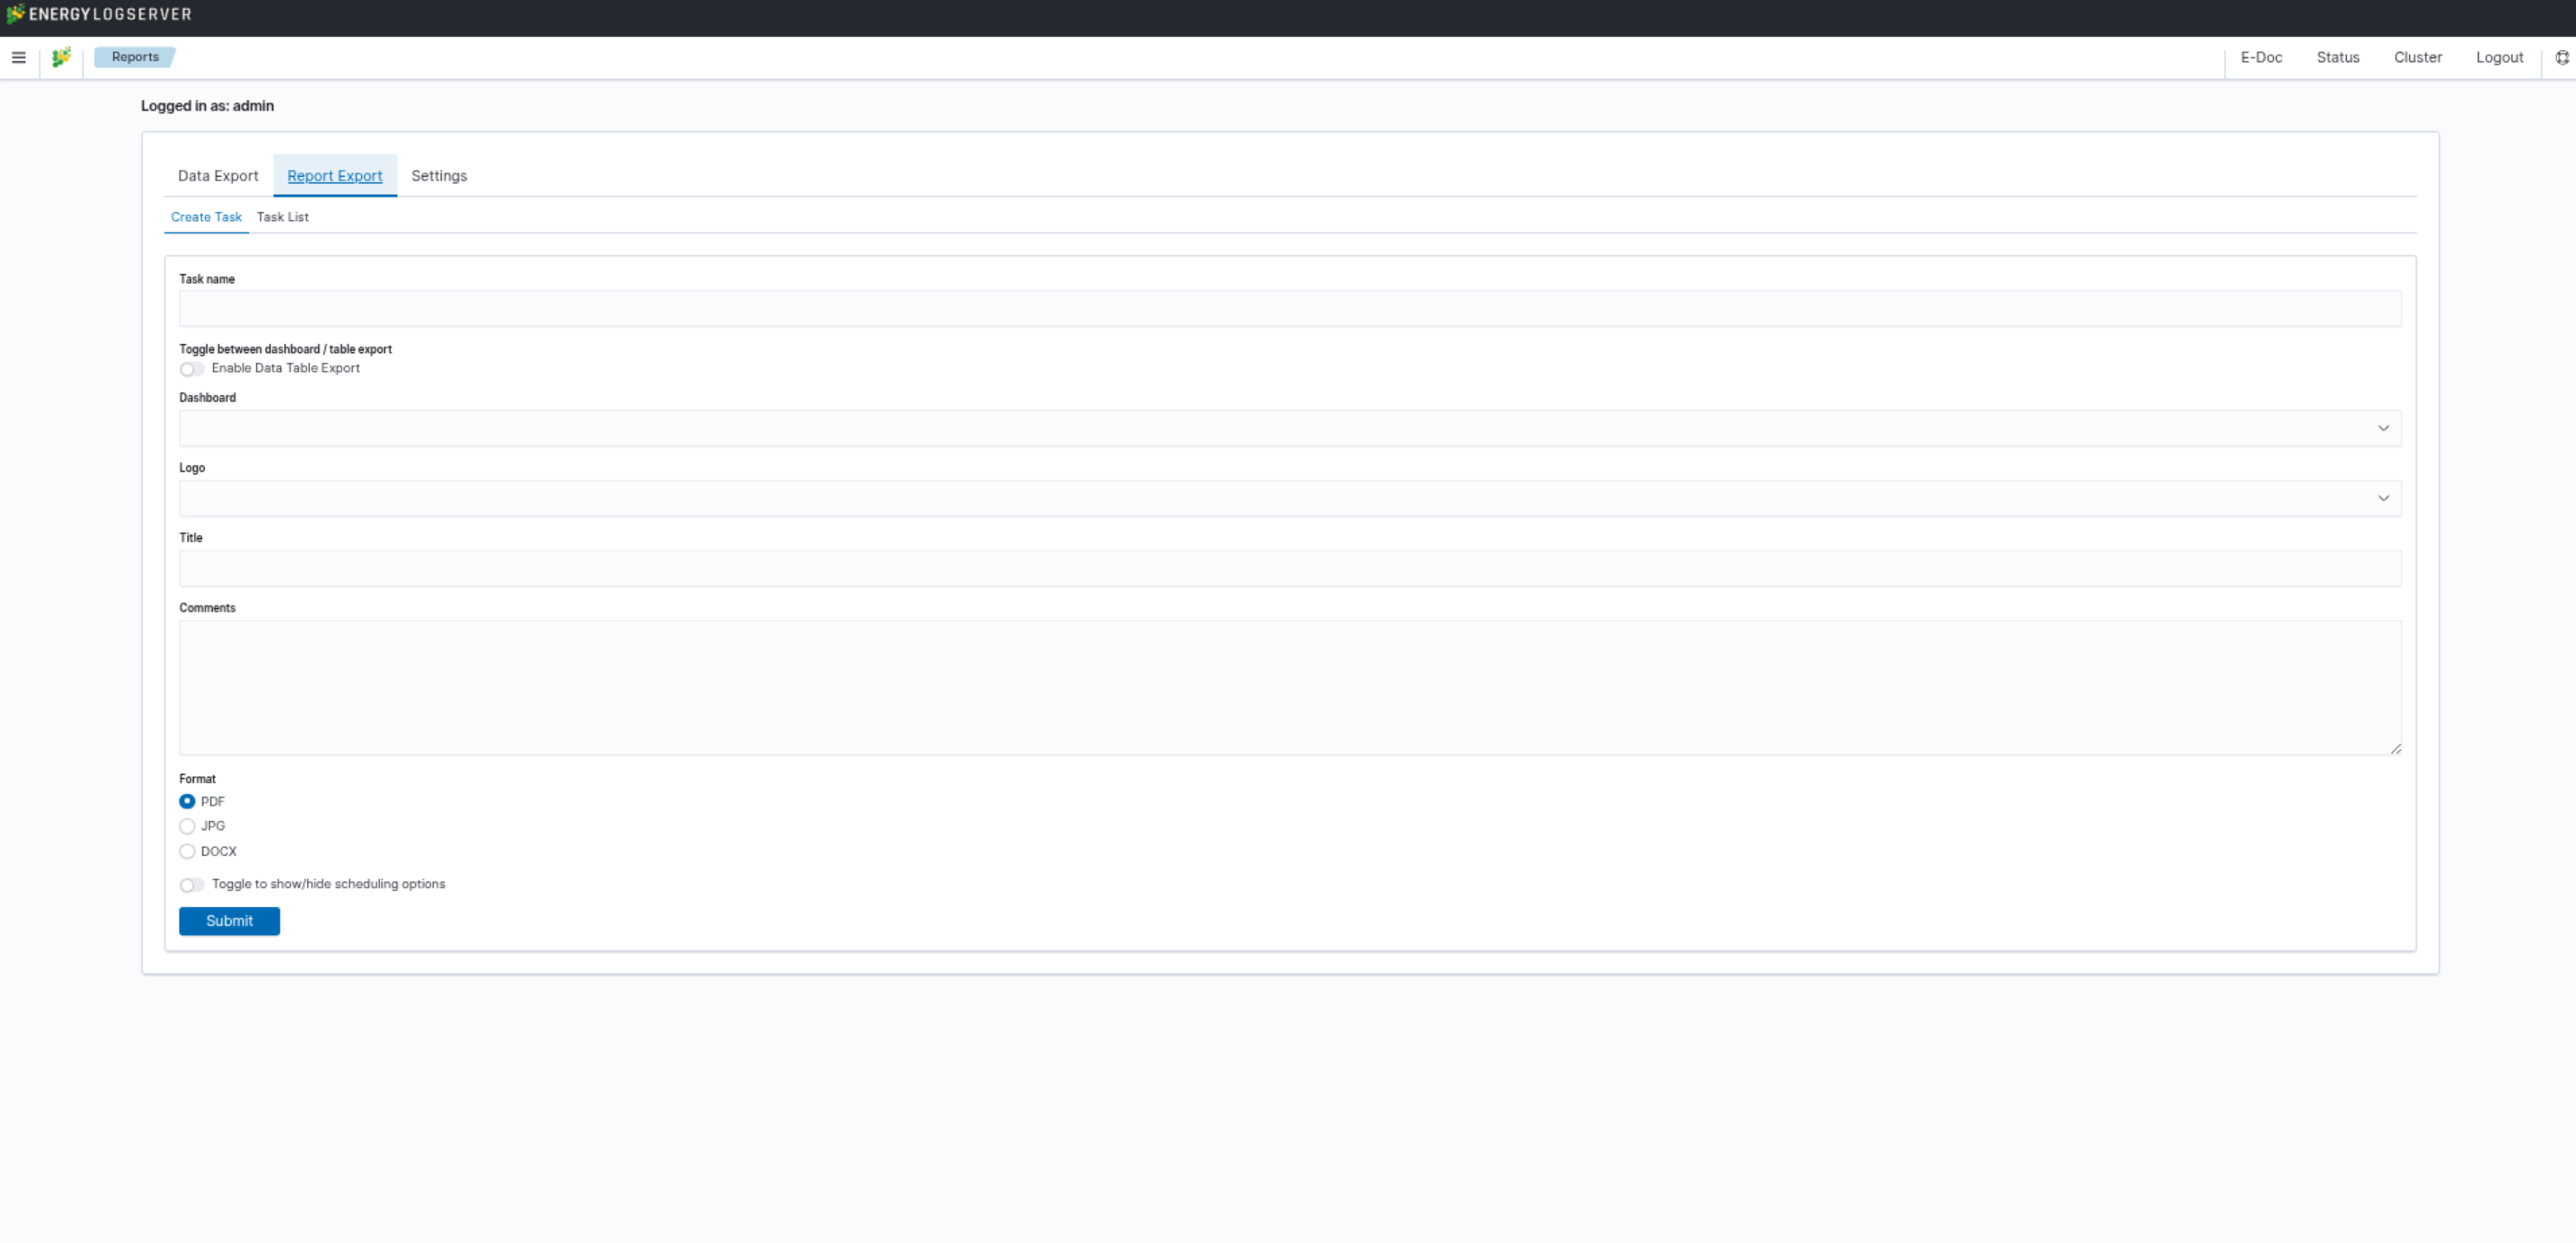
To create a report, go to the Report Export tab and fill in the Create Task form:
Enter a task name in the Task name field.
To export a table visualization instead of a dashboard, enable the Enable Data Table Export toggle.
Select the dashboard from the Dashboard dropdown.
Optionally select a logo from the Logo list.
Optionally add a report title in the Title field.
Optionally add comments in the Comments field.
Select the output format: PDF, JPG, or DOCX.
To schedule automatic report delivery via email, enable the Toggle to show/hide scheduling options toggle.
Click Submit to start generating the report.
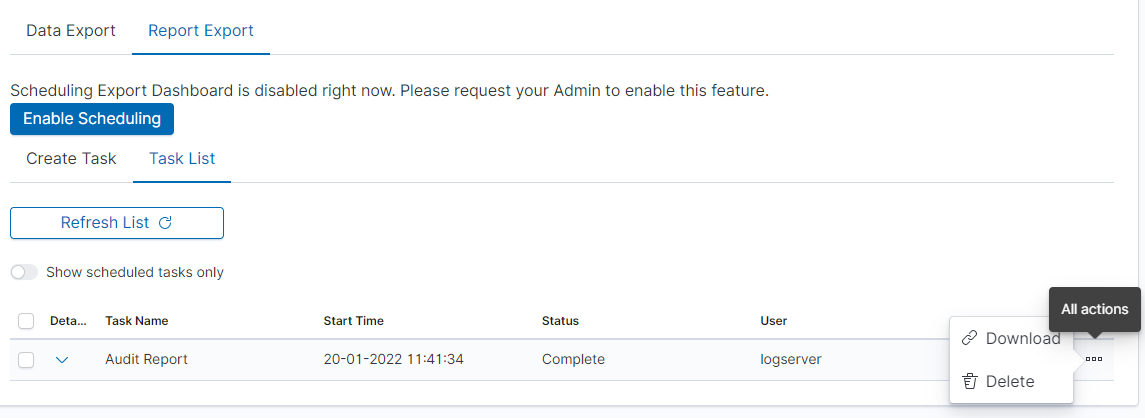
You can monitor the progress in the Task List sub-tab. When the status changes to Complete, download the report via the Download button.
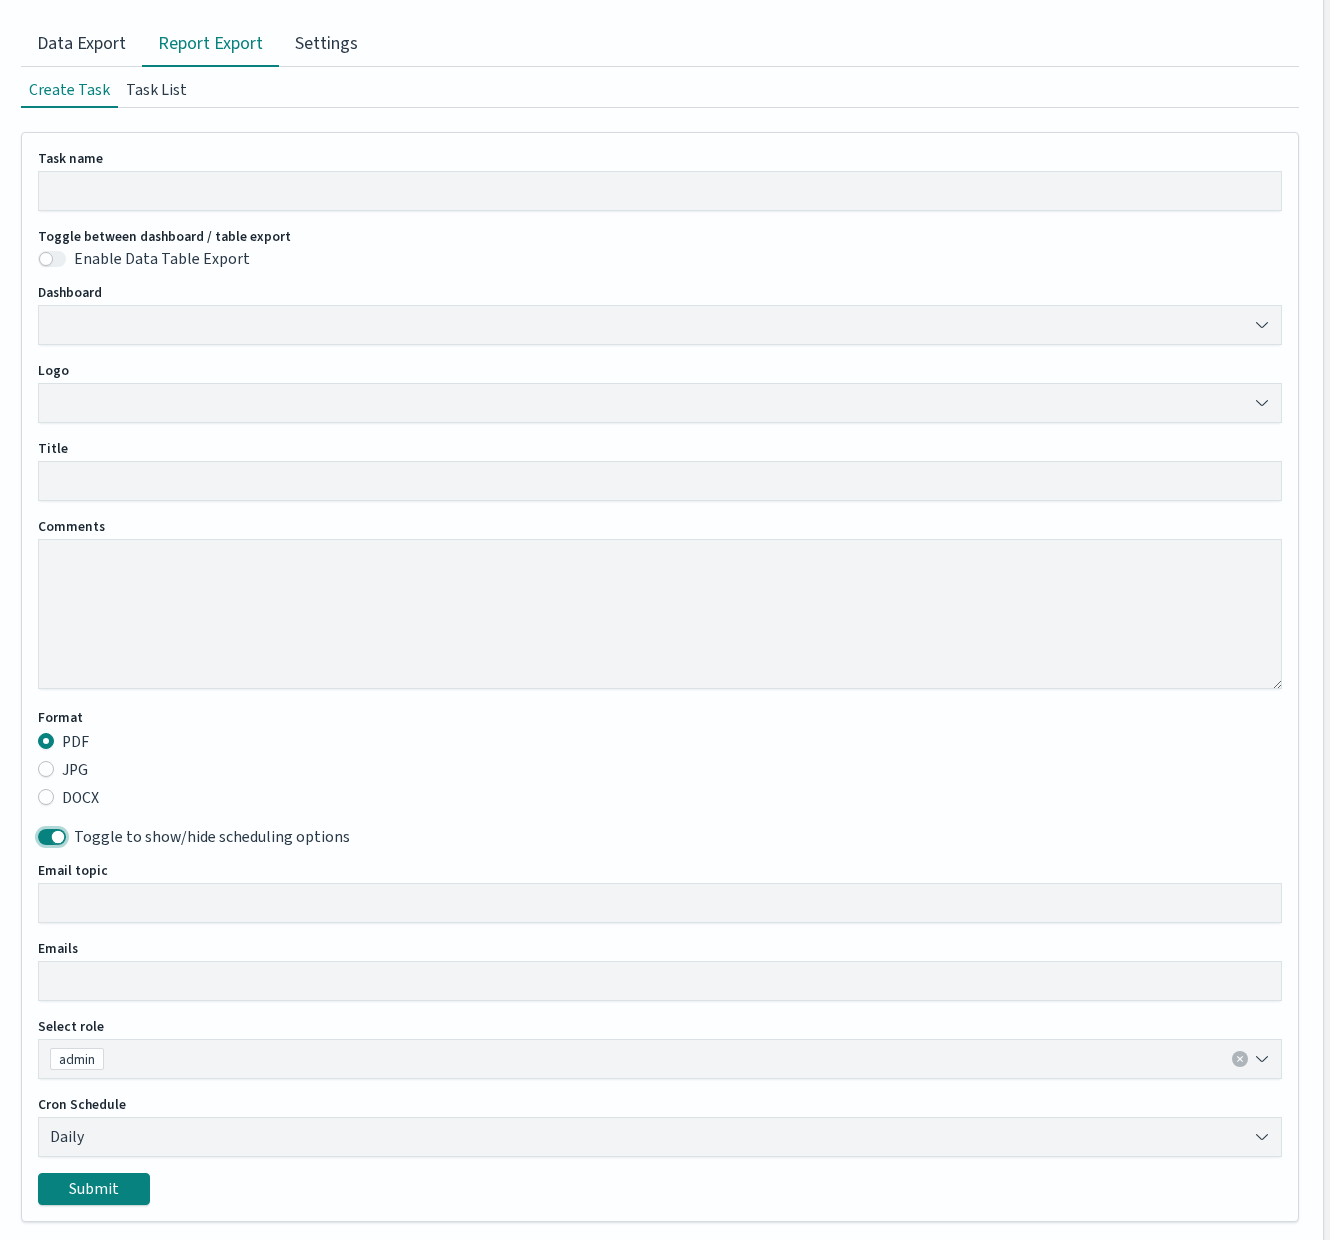
Scheduling a Report Export
Enable the Toggle to show/hide scheduling options to reveal the scheduling fields:
Field |
Purpose |
|---|---|
Email topic |
Subject line of the notification email. |
Emails |
Recipient addresses for the generated report. |
Select role |
Role assigned to the scheduled task. Same semantics as in Data Export — see Role selection for scheduled tasks. |
Cron Schedule |
|
Below is an example PDF report generated from a dashboard template:
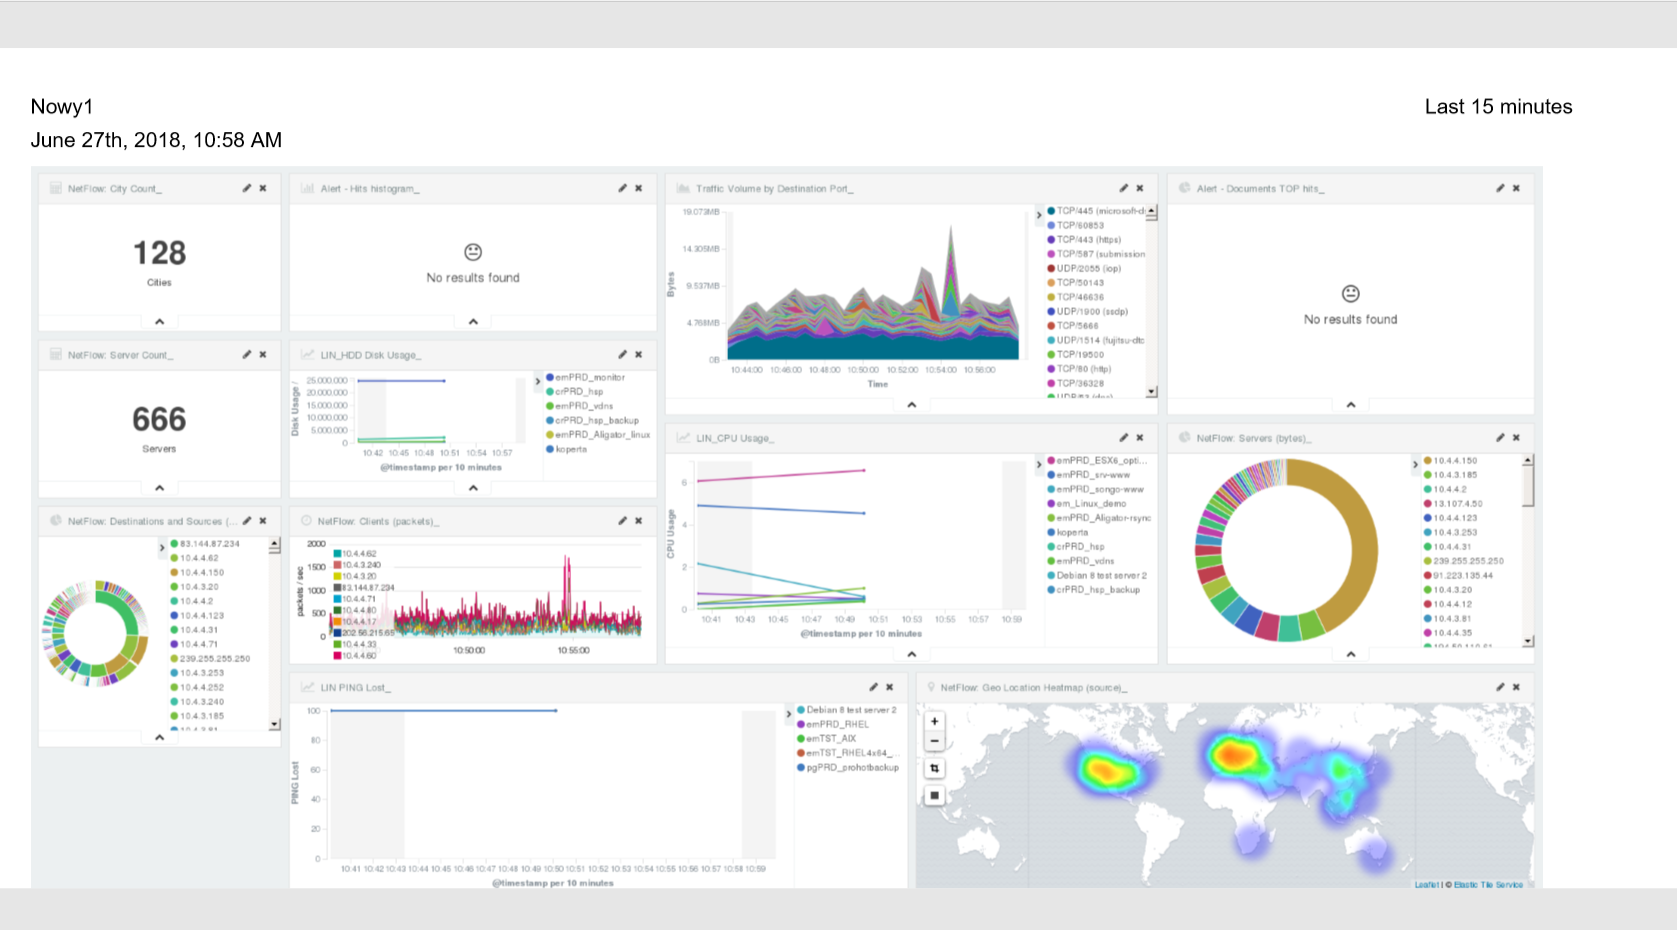
PDF report from table visualization
Data from a table visualization can be exported as a PDF or JPG report:
Go to the Report Export tab.
Enter a task name in the Task Name field.
Enable the Enable Data Table Export toggle:
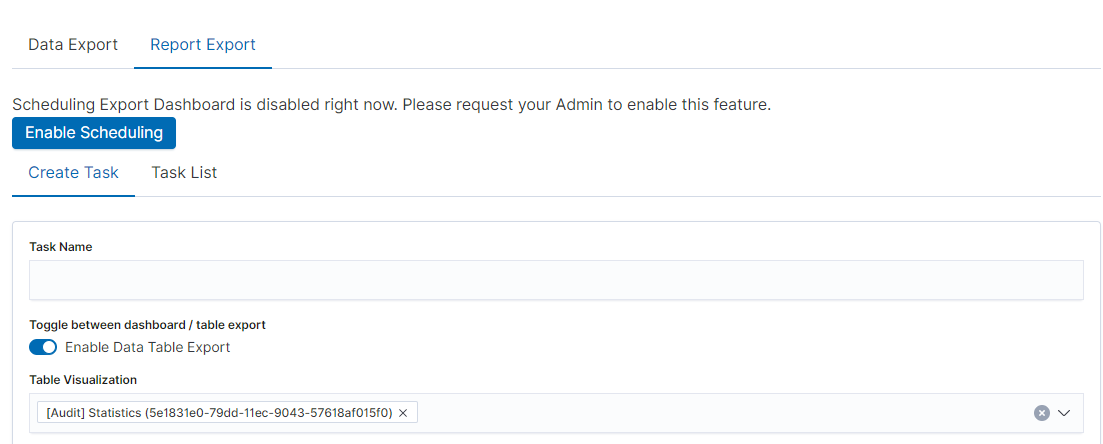
Select the table from the Table Visualization list.
Select the time range for the report.
Optionally select a logo, title, and comments.
Click Submit to start the task.
After the task completes, download the PDF via Action → Download:
Settings
The Settings tab allows you to configure retention periods for generated files and upload a logo for use in report exports.
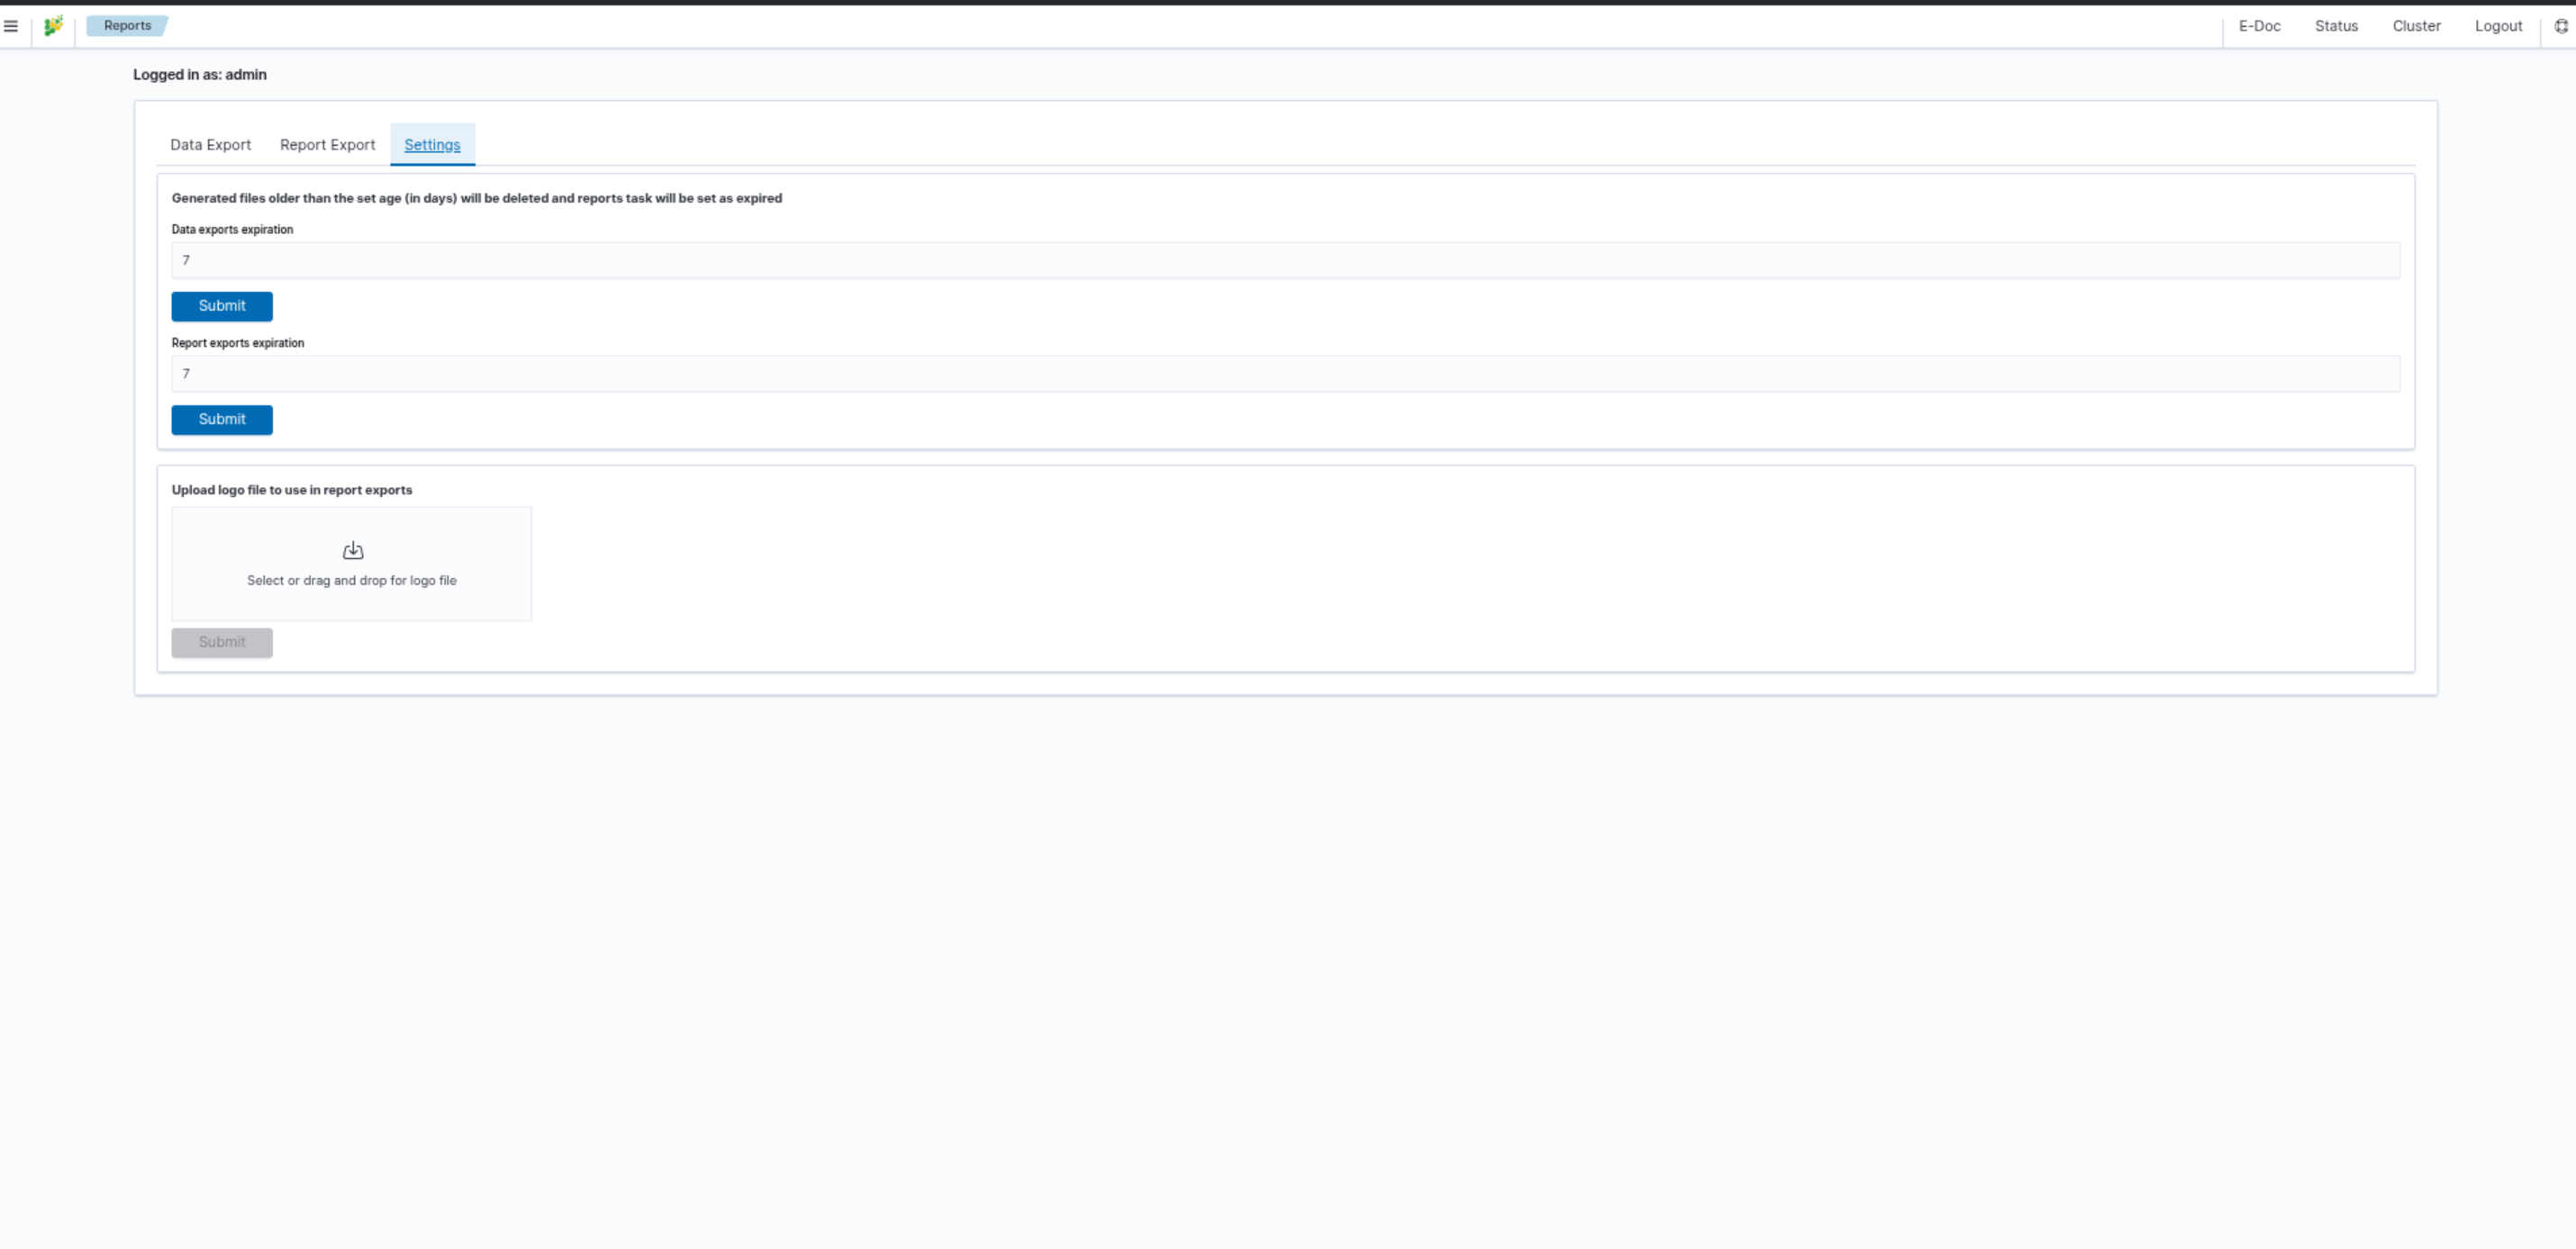
Data exports expiration — number of days after which generated data export files are deleted and tasks are marked as expired. Default: 7 days.
Report exports expiration — number of days after which generated report files are deleted and tasks are marked as expired. Default: 7 days.
Upload logo file — upload a logo image (drag and drop or select file) to use in Report Export tasks.
Confirm each setting with the Submit button.