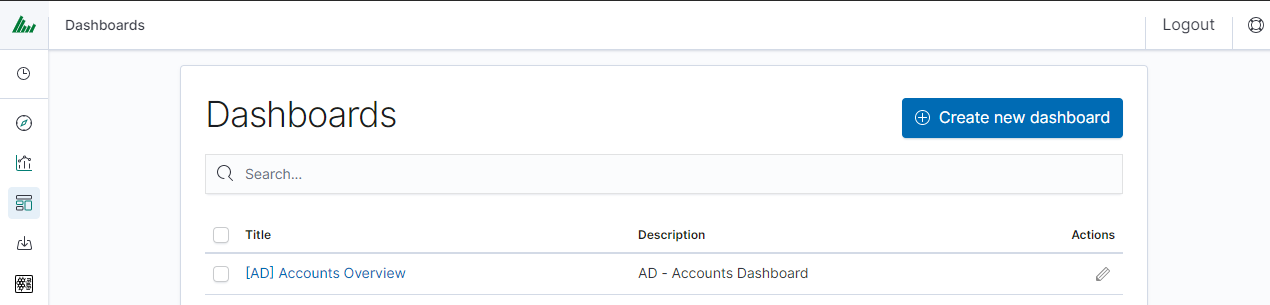
Dashboards
A dashboard is a collection of several visualizations or searches. Depending on how it is built and what visualization it contains, it can be designed for different teams e.g.:
SOC - which is responsible for detecting failures or threats in the company
Business - which thanks to the listings can determine the popularity of products and define the strategy of future sales and promotions
Managers and directors - who may immediately have access to information about the performance units or branches
Creating Dashboards
Create
To create a dashboard from previously saved visualizations and queries, go to the “Dashboard” tab in the main menu. When you open it, a new page will appear.
Click the “Add” icon at the top of the page and select the “Visualization” or “Saved Search” tab.
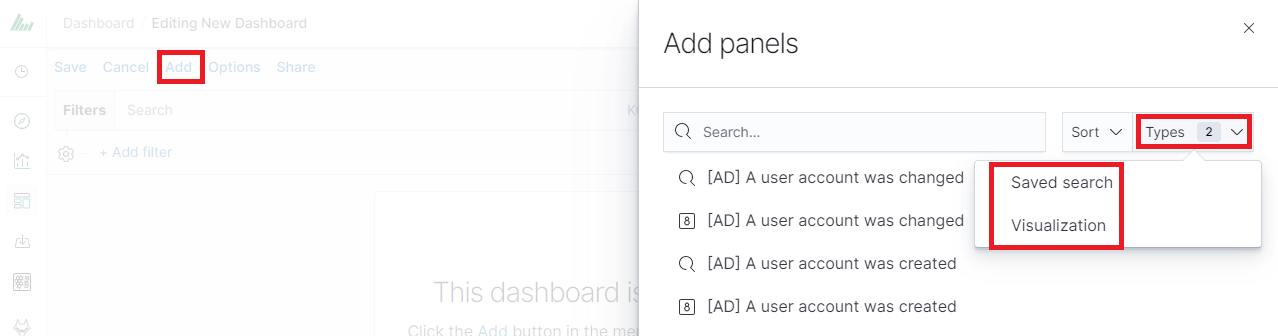
Selecting a saved query and/or visualization from the list will add them to the dashboard. If there are a large number of saved objects, use the bar to search for them by name.
Elements of the dashboard can be enlarged arbitrarily (by clicking on the right bottom corner of the object and dragging the border) and moved (by clicking on the title bar of the object and dragging it).
Saving
You may change the time period of your dashboard.
At the upper right-hand corner, you may choose the time range of your dashboard.
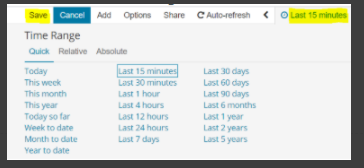
Click save and choose ‘Store time with dashboard’ if you are editing an existing dashboard. Otherwise, you may choose ‘Save as a new dashboard’ to create a new dashboard with the new time range.
To save a dashboard, click on the “Save” button at the top of the query bar and give it a name.
Load
To load a previously saved Dashboard, go to Stack Management → Saved Objects and filter by type “Dashboard”. Select the desired dashboard from the list to open it.
Sharing dashboards
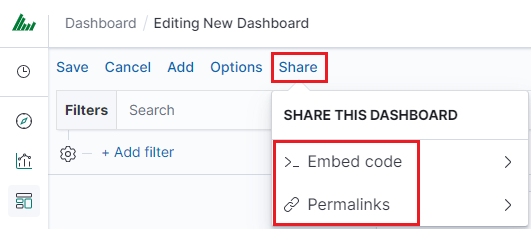
The dashboard can be shared with other Energy Logserver users as well as on any page - by placing a snippet of code. Provided that it can retrieve information from Energy Logserver.
To do this, create a new dashboard or open the saved dashboard and click on “Share” at the top of the page. A window will appear with the generated two URLs. The content of the first one “Embedded iframe” is used to provide the dashboard in the page code, and the second “Link” is a link that can be passed on to another user. There are two options for each, the first is to shorten the length of the link, and the second is to copy to the clipboard the content of the given bar.
Dashboard drill down
In the discovery tab search for a message of your interest
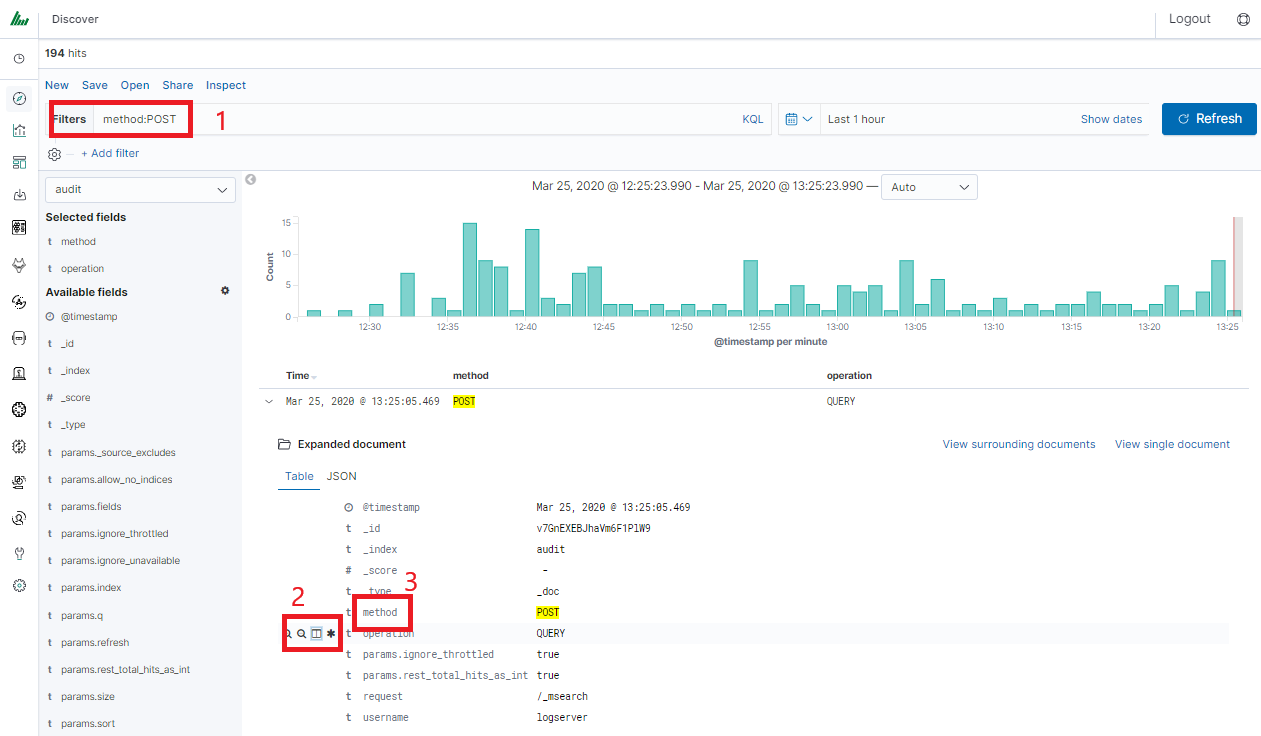
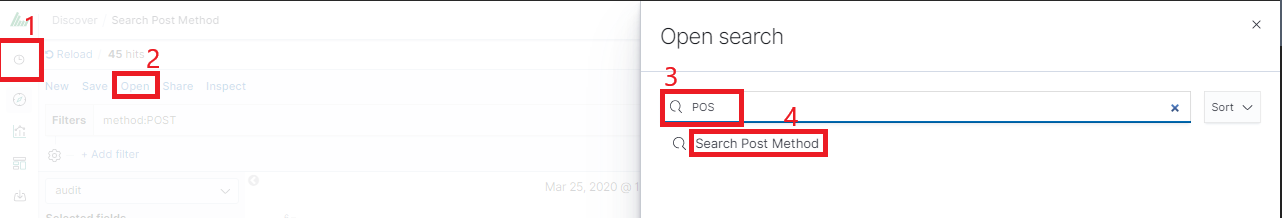
Save your search
Check your “Shared link” and copy it
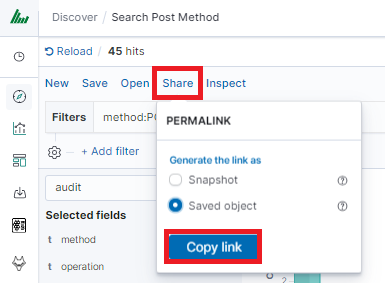
Warning
Do not copy "?_g=()" at the end.